
Over 87% of customers who rate their experience as “very good” are likely to repurchase, emphasizing the importance of Voice of the Customer (VoC) analysis. In contrast, only 18% feel the same when CX ratings drop. Companies that focus on VoC see up to 10x higher revenue growth and a 55% increase in retention, according to studies from the Aberdeen Group.
Clearly, listening to customers is key to long-term success. But what exactly is VoC analysis, and how do you perform one? Let’s explore how to turn feedback into insights that improve CX and drive growth.
What is voice of customer analysis?

Voice of Customer (VoC) analysis is a method for gathering and interpreting feedback from customers to gain insights into their experiences, preferences, and needs.
So, instead of relying on guesswork, VoC analysis uses direct feedback to inform business strategies, improve products or services, and enhance overall customer satisfaction.
Implementing a well-rounded VoC analysis can lead to significant benefits for your business. Here’s how:
1. Boosts customer loyalty
Understanding and responding to customer feedback shows that you value their opinions and are committed to improving their experience. This can transform one-time buyers into loyal customers who feel heard and appreciated.
The direct correlation between effective VoC programs and higher customer retention is clear, as companies with robust programs see significantly increased customer loyalty.
2. Enhances customer satisfaction
When you act on the insights gathered through VoC analysis, you address the specific concerns and needs of your customers. This leads to a more satisfying experience, as changes are directly aligned with their preferences.
Satisfied customers are more likely to stay engaged with your brand and recommend it to others, creating a positive cycle of feedback and improvement.
3. Drives innovation
Voc analysis provides a treasure trove of ideas straight from the source: your customers. It is possible to innovate and create new features or products that satisfy consumer demands by recognizing recurring themes or unmet needs.
This proactive approach keeps your offerings relevant and competitive in the market.
4. Sharpens strategic decisions
Informed decision-making is at the heart of successful business strategies. Voc analysis equips you with concrete data on customer preferences and pain points, allowing you to make decisions that are both strategic and customer-centric.
You can improve your business outcomes in measurable ways by transforming the way you interact and serve your customers by implementing these insights into your operations.
How to analyze the Voice of Customer
To get started with analyzing the VoC, you’ll need to select appropriate methods, decide on the types of data to gather, and choose relevant metrics.
This quote from Jeanne Bliss, Co-Founder of Customer Bliss, comes in handy during this process.
The power of a VoC program lies in its ability to create a direct line from customer feedback to company action. It’s about operationalizing customer empathy to ensure every decision is made with the customer in mind.

Here’s a guide to help you through the process:
1. Selecting the right feedback methods
Analyzing the voice of customer (VoC) starts with choosing the most effective methods to collect feedback. Common approaches include usability testing, surveys, customer interviews, and feedback forms.
- Usability testing helps identify usability issues by observing users interacting with your product.
- Surveys provide broad feedback from a larger audience, covering a variety of experiences and preferences.
- Customer interviews offer in-depth insights into individual experiences, revealing detailed information about customer needs.
- Feedback forms are a straightforward way for customers to share their thoughts and struggles with your product.
To implement any of these research methods in VoC collection process, you need a good research tool at hand. We recommend going for all-in-one solutions like UXtweak, so that you can combine multiple research methods, and analyze all the insights at one place!
Learn more about UXtweak‘s features or try it yourself with our free account! ⬇️

2. Considering data types
Once you’ve selected your feedback methods, the next step is to determine which data to collect.
Qualitative data, gathered through methods like interviews and open-ended survey questions, offers rich insights into customer experiences and perceptions.
Quantitative data, on the other hand, provides numerical insights such as customer satisfaction scores and Net Promoter Scores (NPS) from surveys or task completion rates from usability tests.
Combining both qualitative and quantitative data provides a well-rounded view of customer experiences, helping to capture the full spectrum of feedback.
3. Choosing the right metrics
Selecting the appropriate metrics is crucial for analyzing VoC effectively. For surveys, metrics such as NPS and Customer Satisfaction Score (CSAT) measure overall satisfaction and loyalty.
Usability testing uses metrics like “time on task” and “task success rate” to evaluate how efficiently users complete tasks and identify any difficulties they encounter.
You can make sure you collect all the information you need and make well-informed decisions based on a thorough understanding of customer feedback by concentrating on metrics that match your feedback methods and the goals of your research.
Voice of customer analytics for surveys

Surveys are a key component of voice of customer (VoC) analysis, providing clear insights into customer opinions and experiences. To make the best use of surveys, key metrics must be understood and analyzed.
Each metric sheds light on different aspects of customer experience and satisfaction. Here’s a closer look at several critical survey metrics, how to calculate and analyze them, and their impact on the overall customer experience.
The Net Promoter Score (NPS)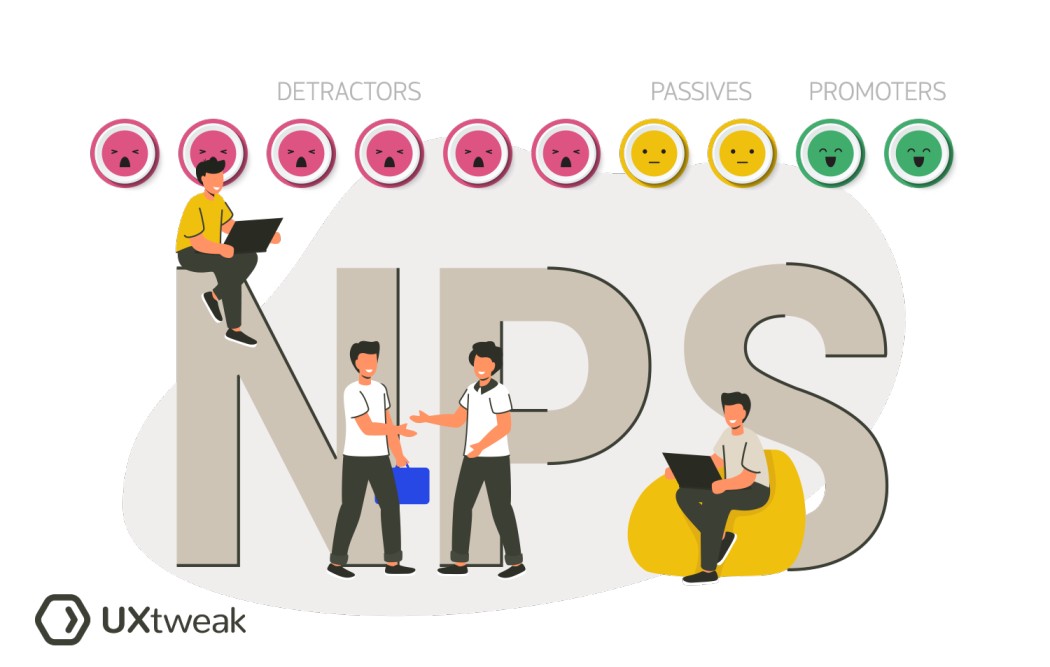
Net Promoter Score (NPS) gauges customer loyalty and the likelihood that customers will recommend your product or service.
To calculate NPS, ask customers to rate their likelihood of recommending your company on a scale from 0 to 10. Subtract the percentage of detractors (scores 0-6) from the percentage of promoters (scores 9-10) to get your score.
For instance, if 60% of respondents are promoters and 10% are detractors, your NPS would be 50.
Analyzing NPS involves looking at the score in the context of customer feedback. A high NPS suggests strong customer loyalty, while a low score indicates some areas need improvement.
For example, a company with an NPS of 50 might focus on enhancing customer service or product features to address concerns raised by detractors.
Customer Satisfaction Score (CSAT)
Customer Satisfaction Score (CSAT) measures how satisfied customers are with a specific interaction or aspect of your service.
Typically measured through a single-question survey, customers rate their satisfaction on a scale from 1 to 5. Calculate CSAT by dividing the number of satisfied customers (those rating 4 or 5) by the total number of respondents and multiplying by 100.
For example, if 80 out of 100 respondents rated their satisfaction as 4 or 5, the CSAT score would be 80%.
Analyzing CSAT involves reviewing the scores to identify trends and areas for improvement. A high CSAT score indicates customers are generally satisfied with their interactions, while a low score suggests issues that need addressing.
For example, if CSAT scores drop after a product update, it might signal that the update introduced new problems.
Customer Effort Score (CES)
Customer Effort Score (CES) assesses how easy it is for customers to achieve their goals or resolve issues with your product or service.
To calculate CES, ask customers to rate the ease of their experience on a scale from 1 to 7. You can do so by averaging the scores given. For instance, if customers rate the ease of resolving an issue with scores averaging 5, the CES would be 5.
To analyze CES identify friction points in the customer journey. A low CES indicates that customers find interactions straightforward and efficient, while a high CES suggests that customers face obstacles.
For example, if CES scores are high during a customer support interaction, it might point to complicated processes or slow response times.
Voice of customer analytics for usability testing

Usability testing metrics help us understand how users interact with our product and identify areas for improvement. These metrics provide insights into various aspects of the user experience, from task completion to overall satisfaction.
Here’s a look at some essential usability testing metrics, how to calculate them, and what they reveal about the customer experience.
Task Success Rate
The task success rate measures the percentage of users who can complete a task without assistance. To calculate this metric, divide the number of users who complete the task by the total number of users tested, then multiply by 100.
For example, if 40 out of 50 users complete a checkout process, the task success rate is 80%.
Analyzing task success rate involves looking at how well users can achieve their goals. A high rate indicates that users find the task straightforward, while a low rate suggests difficulties.
For instance, if the task success rate for a checkout process is low, it may point to issues with the checkout flow or confusing instructions.
System Usability Scale (SUS)
The System Usability Scale (SUS) is a questionnaire used to assess a product’s overall usability. Users rate their agreement with a series of statements on a scale from 1 to 5.
The SUS score is calculated by adding the scores for all items, adjusting for negative statements, and then multiplying by 2.5 to get a score out of 100. For example, if the total score from 10 users is 320, the SUS score would be 80.
To interpret the overall usability impression, a high SUS score indicates that users find the product easy to use, while a low score reveals areas for improvement.
For example, a SUS score of 80 suggests that users generally find the system user-friendly, whereas a score of 50 might highlight usability concerns that need addressing.
The Usability Metric for User Experience (UMUX)

UMUX evaluates a product’s ease of use and user satisfaction. It typically involves a single-question survey in which users rate their agreement with statements about the product’s usability.
The UMUX score is calculated by averaging the scores from the survey responses. For example, if users rate their experience with an average score of 4.2 out of 5, this is the UMUX score.
A high UMUX score indicates a positive user experience, while a low score suggests potential usability issues.
For example, a UMUX score of 4.2 means that users generally find the product easy to use, but scores below 3 might highlight specific areas needing improvement.
Heatmaps

Heatmaps are handy for visual representations of where users click, scroll, or hover on a webpage. They show areas of high and low engagement using color codes.
To calculate this metric, analyze the density of user interactions across different page sections.
For example, if users frequently click on a specific button, it will appear in a warmer color on the heatmap.
Finding patterns in user behavior is part of the heatmap analysis process. Areas with high engagement can indicate effective design elements, while low-engagement areas may require adjustments.
For instance, if a call-to-action button receives little attention, it might be worth repositioning or redesigning to make it more prominent. Heatmaps are a great way to find out how to improve a website’s UX without sacrificing quality and results delivery.
Find out more usability testing metrics with our video guide:
Voice of customer analytics for customer interviews
A few essential techniques are used to analyze qualitative data from customer interviews, yielding insightful information about users’ needs and experiences.
These techniques help identify patterns, sentiments, and user journeys, which are crucial for improving the overall customer experience.
Let’s explore three essential approaches and how they contribute to a deeper understanding of your customers.
Affinity Mapping
Affinity mapping is all about organizing and grouping qualitative feedback into themes. Begin by jotting down key points from your interviews on sticky notes.
As you review these notes, start grouping them based on common themes or recurring issues. For instance, if users frequently mention problems with a feature, gather these comments together under a “Feature Issues” category.
When you analyze these clusters, look for overarching trends and significant patterns. Identifying recurring themes can reveal areas for improvement or where users face challenges.
This method helps you visualize connections between different pieces of feedback and guides you toward actionable changes.
Sentiment Analysis
Voice of customer sentiment analysis focuses on understanding the emotions behind customer feedback. You can do this manually by reading through interview transcripts and classifying comments as positive, negative, or neutral.
Alternatively, there are tools available that can automate this process.
The goal is to gauge the overall mood of the feedback. Positive comments might indicate features that delight users, while negative ones highlight potential pain points.
Analyzing sentiment helps you pinpoint areas where users are either thrilled or frustrated, providing a clear view of what’s working and what needs improvement.
Journey Mapping
Journey mapping helps you visually capture your customer’s experience with your product or service.
Start by outlining the key stages of their journey—everything from their initial interaction with your brand to how they use the product and their post-purchase experience.
Adding an empathy map at each stage provides deeper insights, allowing you to understand what your customer thinks, feels, and does at every step.
As you build your journey map, detail each touchpoint and note the emotions, challenges, and needs experienced at each stage. This helps you identify critical moments where users might be experiencing difficulty or satisfaction.
For instance, if a journey map shows users struggling during the onboarding phase, it highlights an area ripe for enhancement.
Remember these six tips on how to create a user journey map with examples, that stands out from the crowd:
Sharing Research Results
Communicating your VoC research findings to stakeholders is essential for driving meaningful change. You can present these insights in various formats, such as executive presentations, detailed reports, or research repositories.
The key is to choose a format that effectively conveys the results and recommendations.
Sharing results ensures that the insights lead to actionable improvements. A well-organized presentation can highlight key findings and recommendations briefly, while a detailed report provides comprehensive analysis and context.
Properly sharing research results helps align your team with user needs and drives improvements that enhance the customer experience.
Remember,
A robust Voice of the Customer program is not just about gathering data—it’s about creating a dialogue with your customers. It’s an ongoing conversation that informs strategy, shapes innovation, and ultimately, builds loyalty. 
The best UX research reports tick 5 of these boxes. Find out what they’re here.
Wrapping up
We’ve explored how CX professionals present their findings to stakeholders, often using specialized tools or VoC templates to streamline the process.
To enhance your Voice of Customer (VoC) efforts, it’s crucial to understand and leverage various analysis methods and metrics effectively.
If you’re searching for a robust tool to assist with VoC analytics and reporting, UXtweak is an excellent choice for you.
We offer extensive analytics and automatically generated reports, as well as multiple ways of data export to help you uncover actionable insights and communicate them effectively.