In this help, we’ll discuss how to use the Lostness Metric analysis to:
- View Lostness Metric per task
- Discover Total/Unique Pageviews to Complete Task
View Lostness Metric per task 
- This analysis displays Lostness Metric* and related information one task at a time
- Use the task selection dropdown list in the top section of the screen to switch to the task you want to analyze.
- Alternatively, use the arrow buttons to the left and right of the dropdown list to move to the previous/next task.
For each task, you will find its Lostness Metric (the number in the circle in the upper right corner of the analysis)
The Lostness Metric is calculated as a gauge of effectiveness of your website’s navigation. It tells you how lost your users get when they use your website (when they solve your tasks). Lostness is based on the difference between the number of pages visited by the user and the minimum number of pages that need to be visited to solve the task (the optimal path). If you haven’t entered an optimal number in task setup, we automatically consider the minimum number of pages traversed by a respondent to be the optimal path. (However, this respondent may or may not also have been lost, which is why we recommend properly setting up the length of the optimal path for your tasks.)
To the left of the Lostness Metric, you will find the Optimal path, which is either the number that you configured in setup, or if you haven’t, the length of the shortest path traversed by the respondents. You can change this value to recalculate lostness (for example, if you made a mistake while setting up your study) Caution: this value will not be saved.
Lostness is calculated as the average lostness of all respondents who successfully completed the task. A high lostness score (closer to 1) means that users are very lost and have a problem with solving the task. A low score (closer to 0) means users can solve the task relatively easily.
If there are respondents who completed the task in a shorter number of steps than the optimal path you specified in setup, their lostness has value of ‘0!’ and is not included in the average. Average lostness can have the value of ‘0!’ if all successful respondents have lostness of ‘0!’. If there are no successful respondents, lostness will show ‘No data’.
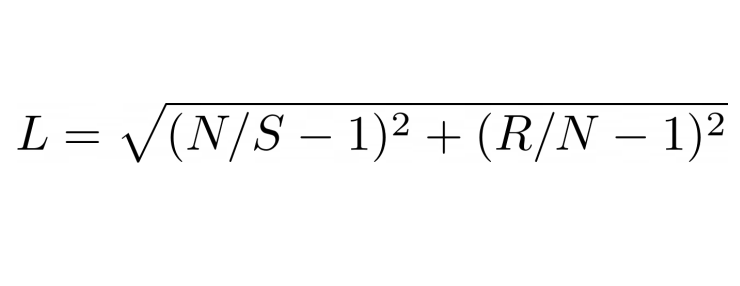
The lostness formula
L = Lostness, N = Number of unique pages visited during the task, S = Total number of pages visited during the task (including re-visits to the same page), R = The optimal path (minimum number of pages that need to be visited to complete the task)
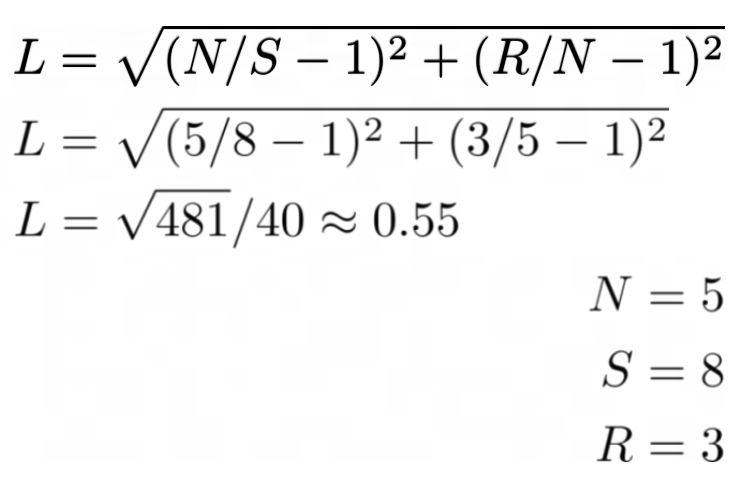
Example how lostness is calculated
Let the optimal path for completing a task be by visiting pages A, B and C. This means R = 3. A respondent completed this task by visiting (in order) pages A, D, E, A, B, A, B and C. The total number of pages visited (S) is 8 (A thrice, B twice, C, D, E), however the unique number of pages (N) is only 5 (A, B, C, D, E). After filling these numbers into the formula, the lostness of this respondent comes at approximately 0.55. This means the respondent was moderately lost, considering they backtracked twice.
* Pauline A. Smith; Towards a practical measure of hypertext usability, Interacting with Computers, Volume 8, Issue 4, 1 December 1996, Pages 365-381.
Discover Total/Unique Pageviews to Complete Task
Aside from the lostness score itself, the Lostness Metric analysis also contains the analysis of Unique Pageviews and Total Pageviews.
- Total Pageviews to Complete Task is the number of pageviews that a respondent went through until they completed the task.
- Unique Pageviews to Complete Task is the number of pageviews the respondent visited that had a unique URL.
- Only the number of pageviews from respondents who successfully completed the task are included in these metrics.
- These metrics are represented by a candlestick chart. The bar illustrates the upper and lower quartiles with the line inside marking the median value
- T-shaped ‘wicks’ in the candle chart mark the highest and lowest number of pageviews

